
Introduction
For plant managers and process engineers across food, pharmaceutical, chemical, and mineral processing facilities, narrow particle size distribution is a core quality metric with direct production consequences. Get it wrong, and downstream problems compound quickly.
When bulk materials arrive caked, agglomerated, or inconsistently sized, every process stage absorbs the impact: hoppers bridge, feeders choke, blending ratios drift, and product quality varies batch to batch.
This article covers what "narrow" means in quantitative terms, how D-values and span measure distribution width, and which equipment choices—particularly upstream conditioning and screen selection—keep PSD tight throughout an industrial operation.
TL;DR
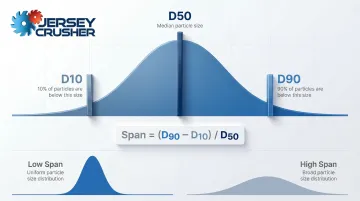
- Narrow PSD means most particles cluster within a tight size range, producing a steep bell curve and a low span value
- Quantified using D10, D50, D90 percentiles; span = (D90 − D10) / D50 — lower span means narrower distribution
- Tighter distributions improve flowability, dissolution rates, reactivity, and blend consistency in pharma, food, and chemical processing
- Wide PSD stems from caking, segregation, over-grinding, or poor feed conditioning
- First-stage lump breakers with replaceable screens (⅛" to 2") re-establish consistent feed sizing before downstream milling
What Particle Size Distribution Means — and What Makes It "Narrow"
Particle size distribution (PSD) is a statistical profile showing the percentage of particles present across specific size intervals within a bulk material sample. It's not a single number — it's a frequency curve that describes how particle diameters are spread across the population.
According to ISO 9276 and ISO 13320 standards, PSD is expressed as either a density distribution (histogram) or a cumulative curve, with the x-axis representing particle diameter and the y-axis showing relative quantity by number, volume, or mass.
The shape of this curve defines whether a distribution is "narrow" or "broad." A narrow PSD produces a steep, sharply peaked curve where the mean, median, and mode are tightly grouped. A wide or broad PSD generates a flat, spread-out curve, indicating large variation in particle sizes within the same batch.
Narrow vs. Wide: What the Curve Shape Tells You
In technical terms, a monodisperse system contains particles nearly identical in size—the ideal narrow distribution that's rare in industrial bulk solids. Most real-world materials are polydisperse, exhibiting a range of sizes that must be statistically characterized. The width of this range determines processing behavior.
Bimodal or multimodal distributions present two or more distinct size populations in the same sample, appearing as multiple peaks on the frequency curve. These are particularly problematic in manufacturing because they signal mixed populations — typically fines and oversized particles coexisting — that behave differently during conveying, blending, and dissolution.
A bimodal distribution often points to one of three root causes:
- Inadequate size reduction leaving oversized particles intact
- Segregation during handling that concentrates fines in one zone
- Agglomerates that bypassed conditioning equipment entirely
Why Industries Target Narrow Distribution
Whether narrow or broad PSD is desirable depends on the application. For most dry bulk material processing — food ingredients, pharmaceutical APIs, fertilizers, chemicals, and mineral concentrates — narrow PSD is the target specification. Tight distributions deliver consistent, predictable behavior: uniform flow through hoppers and pneumatic lines, reproducible dissolution rates, stable reactivity, and reliable blend homogeneity.
Narrow PSD functions as:
- A design specification during product development
- An operational target for production teams
- A quality control checkpoint for batch release
It's not simply a characteristic materials happen to have — it's an engineered outcome requiring deliberate process control.
How Narrow PSD Is Quantified: D-Values, Span, and Distribution Width
Industrial practitioners rely on D-values—percentile values—as the standard numerical language for describing PSD:
- D10: The particle diameter below which 10% of the sample volume falls
- D50: The median diameter (50% below, 50% above)—the central point of the distribution
- D90: The diameter below which 90% of the sample falls
Together, these three percentiles define both the center and the tails of the distribution. D50 anchors the center; D10 and D90 capture how far the fine and coarse tails extend. The span formula converts these three values into a single width metric.
The Span Formula: Quantifying Distribution Width
The span provides a normalized measure of distribution width:
Span = (D90 − D10) / D50
According to Horiba Particle Characterization guidance, a lower span indicates a tighter, narrower distribution. Benchmarks shift by sector, but common reference points are:
- Span below 1.0–1.5: Considered narrow for most applications
- Span above 2.5–3.0: Indicates wide distribution with significant coarse and fine tails
These benchmarks vary by sector—pharmaceutical powders targeting consistent dissolution may specify spans below 1.2, while fertilizer granules may tolerate spans up to 2.0 if flow properties remain acceptable.
Volume-Weighted Mean: D[4,3]
The D[4,3] (De Brouckere mean diameter) is the volume-weighted mean, calculated by weighting each particle's size by its volume rather than by count. This metric is highly sensitive to the presence of large particles or agglomerates, making it a critical indicator for coarse-tail control in quality monitoring.
The companion metric, D[3,2] (Sauter mean diameter), weights by surface area instead. It is more sensitive to fine particles, making it the preferred measure when surface area drives performance (catalysis, rapid dissolution). In short:
- D[4,3]: Use when large particles or agglomerates are the primary concern
- D[3,2]: Use when fine particle surface area governs product behavior
Oversize and Undersize Fractions
Even small proportions of outlier particles show up as secondary peaks or steps in the cumulative curve. Oversize lumps and excessive fines each carry distinct process risks:
- Excess fines: Increase cohesion, elevating Hausner Ratio and Carr Index, which drive hopper arching and ratholing
- Coarse agglomerates: Create slow-dissolving particles, screen blockages, and inconsistent dosing
Why Narrow PSD Matters Across Industries
PSD governs multiple downstream material properties at once — variation in distribution creates cascading effects across processing, safety, and end-product performance.
Flowability and Conveying Behavior
Particles of uniform size flow more predictably through hoppers, feeders, conveyors, and pneumatic lines. Narrower PSDs and larger mean particle sizes generally improve powder flowability, while inconsistent PSD—especially the presence of fines mixed with coarser particles—causes bridging, arching, and uneven metering.
Fine powders are highly susceptible to arching (bridging) and ratholing in hoppers and silos, with severe discharge rate limitations due to counter-flowing air. A wide PSD with high fines content increases interparticle adhesion and cohesion, reflected in elevated Hausner Ratio and Carr Index.
Solubility, Reactivity, and Surface Area
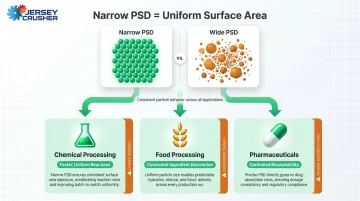
As particle size decreases and distribution narrows, specific surface area increases uniformly across the batch. Surface area uniformity directly affects:
- Chemical processing: Faster, more uniform reactions
- Food processing: Consistent dissolution of powdered ingredients
- Pharmaceuticals: Controlled bioavailability of active ingredients
According to the Noyes-Whitney relation, smaller particles with higher surface-to-volume ratios dissolve faster. When distribution is wide, some particles dissolve or react far faster than others — producing inconsistent outputs and unpredictable product performance batch to batch.
Product Quality and Regulatory Compliance
Industry-specific quality impacts include:
- Pharmaceuticals: PSD affects drug dissolution rate and bioavailability; ICH Q6A mandates particle size specifications if size affects dissolution, bioavailability, or manufacturability
- Food (spices, sugar, flour): Determines texture, mouthfeel, and blending uniformity
- Fertilizers and chemicals: Affects dosing accuracy and reaction efficiency
USP <788> strictly limits subvisible particulate matter in injections, requiring virtual elimination of particles ≥10 µm and ≥25 µm. For injectable drug manufacturers, controlling the coarse tail of the distribution is a compliance requirement with direct patient safety consequences.
How PSD Is Measured and Validated in Practice
Selecting the correct analytical technique depends entirely on size range and material properties.
Sieve Analysis
- Range: ~75 µm to >125 mm
- Best for: Coarser bulk materials like granules, fertilizers, grain
- Limitation: Below 75 µm, cohesion and electrostatics cause particles to stick, invalidating results
- Standards: ASTM E11, ISO 3310-1
Laser Diffraction (Static Light Scattering)
- Range: 0.1 µm to 3 mm (extendable)
- Mechanism: Measures particle size indirectly from scattered laser light pattern
- Advantages: Covers wide range, produces volume-based distributions, most widely used for industrial powders
- Assumption: Assumes spherical particles (reports equivalent spherical diameter), introducing error with non-spherical particles
- Standards: ISO 13320, USP <429>
Dynamic Light Scattering (DLS)
- Range: 0.3 nm to 10 µm
- Best for: Sub-micron particles, colloidal systems, nanoparticles in suspension
- Mechanism: Tracks Brownian motion of particles in dilute suspension to calculate hydrodynamic diameter
- Standards: ISO 22412
Dynamic Image Analysis (DIA) and SEM
- Range: ~100 nm to 8 mm
- Advantages: Direct measurement of particle shape, length, and width; detects small quantities of oversized/broken particles
- Limitation: Slow, requires large sample counts for statistical validity
- Use case: Complementary to other methods—verifying agglomeration, shape characterization, morphology confirmation
Beyond lab-based methods, many industrial processes now deploy in-line or at-line sensors for real-time PSD monitoring during milling or mixing. Case studies show in-line image analysis matched off-line reference methods within 5% and detected a nearly 50% increase in particle size when process conditions changed, enabling rapid process optimization and reducing batch failures.
What Causes Wide PSD — and How Equipment Corrects It
Wide or inconsistent PSD typically results from predictable upstream causes and requires targeted equipment interventions to restore uniformity.
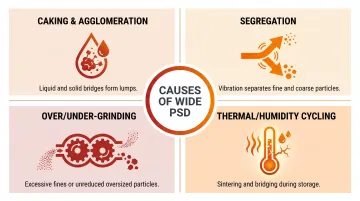
Root Causes of Wide PSD
- Caking and agglomeration: Moisture migration, temperature fluctuations, and storage at rest cause particles to form liquid and solid bridges, compressing fine particles into cohesive lumps that widen distribution considerably.
- Segregation: Vibration and handling cause particles of different sizes to separate, producing variable feed composition downstream and bimodal distributions.
- Over- or under-grinding: Mills operating outside optimal parameters generate excessive fines or leave oversized particles unreduced, broadening the distribution at both ends.
- Thermal or humidity cycling: Environmental changes during storage or transport cause particle sintering or bridging, introducing irregularities before primary size reduction even begins.
Restoring Uniformity: Pre-Conditioning and Milling
Research shows that passing compacted powders through a lump breaker or conditioning sieve significantly narrows PSD (lowers span), reduces fine particle proportion, and improves flowability. Lump breakers serve as the first-stage tool, fracturing agglomerated or caked material back into free-flowing particles before downstream milling, conveying, or dosing.
Skip this pre-conditioning step and the consequences stack up fast: oversized lumps bypass screens, skew the distribution, and send irregular output cascading through the entire process line.
In conical mills and other size reduction equipment, screen aperture is the most critical parameter for controlling the upper limit of PSD. Smaller screen hole sizes increase residence time, capping the D90 and preventing oversized particles from passing downstream.
Jersey Crusher's LUMPBUSTER® machines apply this directly. Replaceable screens with hole diameters customizable from ⅛" to 2" (and beyond for specific applications) let operators define the maximum particle size leaving the machine. Operators specify screen hole diameter to set the D90 ceiling and tighten overall span. The dual counter-rotating rotor design restores feed uniformity before downstream processing begins.
Screen selection involves real trade-offs. Tighter screens reduce maximum particle size but increase residence time and power draw; larger screens boost throughput but allow wider distributions. Process engineers need to match screen specifications to target PSD requirements rather than defaulting to a single standard setup.
Mills and air classifiers further refine distribution, but both rely on feed material already pre-conditioned to a manageable size range. That dependency makes first-stage lump breaking the foundation of the sequence: establish uniform feed first, then let precision milling do its job on material that's already within range.

Frequently Asked Questions
What is a narrow particle size distribution?
A narrow PSD means most particles in a sample are similar in size, producing a steep, tightly grouped bell curve with a low span value—typically below 1.5. A wide distribution, by contrast, shows significant size variation across the batch and a flat curve with a high span.
What does particle size distribution mean?
PSD is a statistical profile showing the relative frequency of particles at each size class within a material sample. It is typically expressed as a histogram or cumulative curve showing how particle diameters are spread across the sample.
What do D10, D50, and D90 mean in a particle size distribution?
D10, D50, and D90 are percentile values. D10 is the diameter below which 10% of particles fall, D50 is the median size, and D90 is the diameter below which 90% of particles fall. Together, they define the center point and spread of the distribution.
What is the meaning of D[4,3] (D 4 3) in particle size measurements?
D[4,3] is the volume-weighted mean diameter, calculated by weighting each particle's size by its volume rather than by count. This makes it highly sensitive to the presence of large particles or agglomerates, making it a valuable metric for monitoring coarse-tail control.
What is the difference between DLS and SEM for particle sizing?
DLS measures particle size indirectly from light scattering and is best for sub-micron particles in suspension (0.3 nm to 10 µm). SEM provides direct visual measurement with shape characterization, suited for solid particles down to ~100 nm.
Why is particle size important in the pharmaceutical industry?
PSD in pharmaceuticals directly affects drug dissolution rate, bioavailability, and dosing accuracy. Regulators including the FDA and USP set strict particle count limits because particles outside the target size range can impair drug delivery, cause adverse effects, or fail dissolution testing required for batch release.