
This guide covers what particle size distribution (PSD) actually is, how to read and use D-value metrics, why PSD matters across food, chemical, fertilizer, pharmaceutical, and mineral processing industries, and what equipment and practices reliably deliver consistent results.
Key Takeaways
- Particle size distribution (PSD) describes the full range of particle sizes in a bulk material sample, not a single average value
- D10, D50, and D90 are the standard control metrics; span measures distribution width
- PSD affects flowability, reaction rates, dissolution, yield, and regulatory compliance
- Lump breakers with integrated screens are the primary tool for controlling output particle size in bulk solids processing
- Define target D-values before selecting equipment, then validate with material testing
What Is Particle Size Distribution?
Particle size distribution is a measurement of the range and frequency of particle sizes present in a bulk material sample. It is not a single number — it's a profile. Malvern Panalytical defines PSD as the relative amount of particles present by size, and ISO 9276-1 covers its graphical representation in histograms and distribution densities.
Single Size vs. Full Distribution
Knowing the average particle size of a material is like knowing the average height of a sports team. It tells you something, but it doesn't tell you whether your roster includes players ranging from 5'4" to 6'8" — or whether everyone is clustered near 6'0". On the production floor, that range is what determines whether your process runs smoothly or fails.
A narrow distribution means most particles are close to the target size — consistent, predictable, and process-friendly. A wide distribution introduces variability that can compromise downstream processing, product quality, and yield. Both situations are visible in the PSD curve; a single average hides them.
Reading a PSD Curve
PSD is typically visualized as a frequency curve or histogram with:
- X-axis: Particle size (diameter)
- Y-axis: Frequency or percentage of particles at each size
The shape of this curve tells operators whether their process is delivering consistent output or producing a problematic mix of oversized and undersized particles. A tight, symmetric bell curve signals uniform output. A broad or skewed curve flags fines buildup, oversize contamination, or mixed-mode production.
Most industrial instruments express particle size as an equivalent spherical diameter. Irregular or angular particles — common in bulk solids — behave differently from spheres in terms of flow, compaction, and reaction rates. Knowing this matters when comparing readings across instruments or materials: the numbers are consistent, but they describe geometry, not behavior.
Key Parameters: Understanding D-Values and Distribution Metrics
HORIBA's particle characterization guidance makes a clear point: a single number cannot fully describe a distribution. That's why D-values are the standard control metrics in industrial and manufacturing contexts.
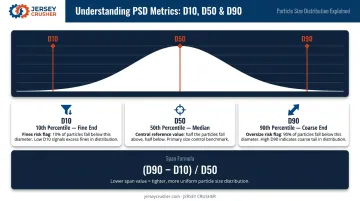
D10, D50, and D90 Defined
| Metric | Definition |
|---|---|
| D10 | 10% of particles are smaller than this size |
| D50 | Median — 50% of particles are smaller, 50% are larger |
| D90 | 90% of particles are smaller than this size |
Together, these three values describe where a distribution is centered and how widely it spreads. D90 flags oversize risk; D10 flags fines risk. Both tails matter operationally — oversized lumps cause blockages, while excess fines cause dusting, bridging, and flow failures in hoppers and feeders.
Span: Measuring Distribution Width
Span is calculated as:
Span = (D90 − D10) / D50
A lower span indicates a tighter, more uniform particle size distribution. A higher span signals more variability. This single number gives operators a fast way to assess whether a process is in control or drifting.
Why Mean Alone Is Misleading
Mean, median, and mode can diverge significantly in skewed or multimodal distributions. A process producing a mix of very fine and very coarse particles can show a perfectly acceptable mean while the actual output causes downstream problems.
Tracking D-values across the full curve catches these hidden distribution problems before they reach downstream equipment.
How Particle Size Impacts Industrial Processes
Particle size directly affects how bulk materials behave in handling systems. Smaller particles tend to flow poorly, clump, or bridge in hoppers and conveyors. Oversized lumps cause blockages and unplanned downtime. Getting the particle size range right for a given material and handling system isn't optional — it's foundational to operational continuity.
Food and Spice Processing
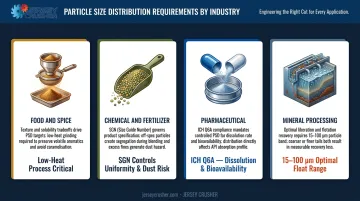
Particle size affects texture, flavor release, solubility, and shelf life. Research on alfalfa leaf powder found that reducing D50 from 506 µm to 20.68 µm increased solubility from 24.15% to 29.09% — but also raised compressibility, which affects flowability. The tradeoff is real: finer particles improve solubility and sensory intensity while worsening flow behavior.
For spice processing specifically, the stakes go beyond particle size numbers. Oversized particles in blends create inconsistent seasoning intensity; fine dust generates waste and flavor loss. Heat-sensitive spices require low-impact, low-heat size reduction methods to preserve the essential oils and volatile compounds that define product quality.
Aggressive hammer or ball mill methods destroy what processors are trying to sell.
Jersey Crusher's Lump Busters® and Particle-izers use a gentle shearing approach — counter-rotating rotors rather than heavy pounding — specifically because food applications require preserving product integrity during size reduction.
Chemical and Fertilizer Processing
Off-spec particle size in chemicals affects reaction rates, dissolution times, and downstream handling costs. In fertilizer production, Ohio State Extension research confirms that particle size and size distribution directly influence spread width and uniformity. Fines and dust are problematic for spreading equipment and create segregation during blending and transport. Larger granules may apply unevenly; fine particles increase dust hazards and clumping.
The Size Guide Number (SGN) — median particle diameter in millimeters multiplied by 100 — is the standard industry metric for fertilizer particle specification. Controlling PSD tightly against the target SGN reduces segregation in blended fertilizer products and supports consistent field application.
Pharmaceutical and Mineral Processing
In pharmaceutical manufacturing, ICH Q6A states that PSD may significantly affect dissolution rates, bioavailability, and stability. The FDA treats PSD as a critical physical property when evaluating post-approval manufacturing changes. PSD control in pharma isn't a best practice; it's a compliance requirement.
Where pharma faces regulatory thresholds, mineral processing faces recovery ones. A 2024 review in Minerals Engineering reports that sulphide minerals float most effectively at 15 to 100 µm. Copper tailings losses run approximately 50% below 20 µm and 30–40% above 150 µm. PSD governs recovery efficiency directly — not just how fast material moves through the circuit.
Recycling Operations
Consistent particle size in recycled materials — foam, cardboard, tissue, plastics — enables efficient downstream processing and reduces equipment wear from oversized pieces. Inconsistent sizing creates bottlenecks throughout the processing line and can reduce the value of recovered material. Research on recycled paper confirms that shredding degree directly affects papermaking potential, making particle size a process-quality variable with direct impact on end-product value.
Equipment for Particle Size Control in Industrial Operations
The main categories of industrial size reduction equipment for bulk material processing include:
- Lump breakers — for breaking agglomerated, caked, or lumpy materials to a target size
- Particle-izers — for producing fine, evenly sized particles with tighter size control
- Crushers and mills — for coarser or harder materials
- Screening systems — for classification after size reduction
Material properties, target output size, and throughput requirements all drive the selection — and each category handles a different part of that equation.
Lump Breakers: The Primary Tool for Bulk Solids
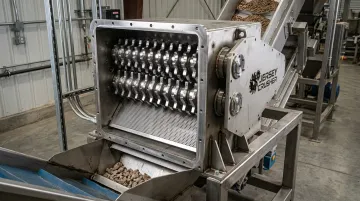
Lump breakers work by passing material through counter-rotating rotor shafts that shear apart agglomerated or oversized material. The output size is controlled by integrated screens — the screen hole diameter physically prevents oversized particles from exiting the machine. Only material reduced below the screen opening passes through.
Powder & Bulk Solids describes lump breakers as using impact, shear, compression, or abrasion to reduce solids to a target particle-size range, and notes that automated lump breaking reduces downstream mixer and mill wear by controlling large agglomerates before they enter later processing steps.
Jersey Crusher's Lump Busters® integrate size reduction screens with customizable hole diameters from ⅛" to 2" (with additional options beyond 2"). Operators select screen size based on target D90 specification — the screen diameter defines the maximum particle size that exits the machine. This approach means the screen is functioning as the D90 control mechanism in physical form.
Screen Selection and Material Properties
A 2022 peer-reviewed study confirmed that screen size affects output PSD and equipment performance in size reduction equipment. Screen aperture directly influences the upper tail of the output distribution — it constrains D90 — but does not guarantee that D90 equals aperture size exactly, since material properties also influence how particles fracture.
Material characteristics that affect equipment selection:
- Hardness and brittleness — determines fracture behavior and screen wear rate
- Moisture content — wet materials agglomerate differently and can blind screens
- Temperature sensitivity — heat-sensitive materials require low-speed, low-friction methods
- Abrasiveness — drives material construction selection (carbon steel vs. abrasion-resistant variants)
Temperature sensitivity is a deciding factor for materials like spices or food ingredients, where heat generated during size reduction can degrade active compounds. Jersey Crusher's shearing-based design avoids the heat that hammer mills and ball mills produce — a direct result of eliminating heavy pounding from the process.
Integrated Process Systems
For high-volume, continuous operations, a standalone lump breaker is rarely sufficient. Particle size needs to be controlled at every stage — from material conditioning through downstream delivery. A complete process system typically combines:
- Lump Busters® or Particle-izers — for primary size reduction
- Volumetric feeders — for controlled, consistent feed rate
- Screw conveyors — for enclosed material transport between stages
Jersey Crusher designs and supplies integrated systems built to each customer's facility layout and material characteristics.
Best Practices for Achieving Consistent Particle Size Distribution
Define PSD Specifications Before Equipment Selection
Establish target D10, D50, and D90 values based on downstream process requirements before selecting equipment. This prevents costly trial-and-error on the production floor. The reference point depends on the application:
- Fertilizer: work from SGN (Size Guide Number) targets
- Pharmaceutical: work from validated dissolution specifications
- Food processing: know the texture, solubility, and flowability requirements of the finished product
Jersey Crusher offers a free product sample evaluation service — customers ship their actual production material to the Wayne, NJ facility, and the engineering team analyzes the sample and recommends the correct screen diameter, model size, and material construction for the target output specification. This means equipment is matched to actual material behavior before any capital is committed.
Monitor PSD Regularly Throughout Production
Once specifications are set, monitoring keeps production aligned to them. PSD needs measurement at defined intervals — especially after:
- Raw material lot changes
- Extended equipment operation
- Process upsets or unplanned stops
- Cleaning and reassembly cycles
Common industrial measurement methods by material size:
- Sieve analysis (ISO 2591-1): Appropriate for coarser particles and granules
- Laser diffraction (ISO 13320:2009): Applicable from approximately 0.1 µm to 3 mm, used for fine powders and broader industrial PSD measurement
Neither method replaces the other — match the measurement tool to the material size range.
Account for Material Variability and Equipment Wear
Raw material batches vary in moisture content, hardness, and incoming particle size. All three shift output distribution, often in ways that aren't immediately obvious.
Worn breaker bars or screens allow oversized particles to pass that wouldn't have passed when the equipment was new. That drift is often gradual enough to go unnoticed until a downstream quality failure triggers the investigation.
Consistent PSD performance over time requires:
- Regular inspection of screens and breaker bars for wear
- Replacement screens matched to original or updated specifications
- Spare parts availability to avoid extended downtime during maintenance
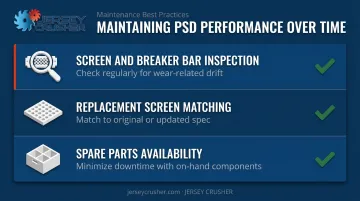
Jersey Crusher maintains spare parts inventory for the full equipment line — including replacement screens across the full ⅛" to 2" diameter range — with fast turnaround and expedited order options to minimize production downtime.
Frequently Asked Questions
What is the difference between particle size and particle size distribution?
Particle size refers to the measurement of a single particle. Particle size distribution describes the range and frequency of all particle sizes within a bulk material sample. PSD gives a complete picture of material consistency; a single particle size measurement cannot reveal whether a batch is uniform or variable.
Why does particle size distribution matter in manufacturing?
PSD directly affects product quality, process efficiency, flowability, reaction rates, and yield. Inconsistent PSD leads to off-spec product, equipment blockages, wasted material, and increased operating costs across virtually every industry that processes bulk solids.
What are D10, D50, and D90 values?
These are cumulative percentage markers. D50 is the median particle size; D10 means 10% of particles are smaller than this value; D90 means 90% are smaller. Together, they describe the center and spread of a distribution in ways a single average cannot capture.
What equipment is best for controlling particle size in bulk material processing?
Lump breakers are the standard choice for breaking agglomerated or oversized bulk materials to a target size range, with output size controlled by integrated screens. Selection depends on material properties, required output size, and production throughput. Jersey Crusher offers a free sample evaluation service to match equipment configuration to actual material characteristics.
How do I choose the right screen size for a lump breaker?
Screen selection starts with your target maximum output size (typically the D90 value), factoring in material hardness and required throughput. Testing actual production samples with an equipment manufacturer before purchase is the most reliable way to confirm the right screen hole diameter.
Which industries rely most on particle size control?
Chemical processing, food and spice processing, pharmaceutical manufacturing, fertilizer production, mineral processing, and recycling are the primary verticals. Any industry processing bulk solids benefits from tight PSD control; the failure modes differ by sector, but consistent particle size is universally tied to product quality and process reliability.